

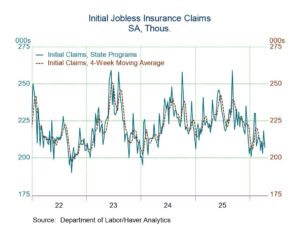
- New claims fell by 11,000 to 207,000.
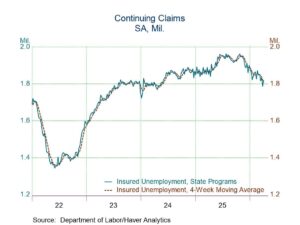
- Continuing claims jumped 31,000 to 1.818 million.
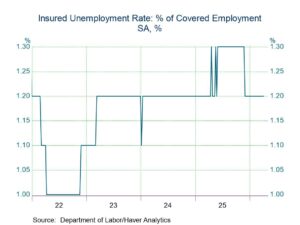
- The insured unemployment rate was unchanged at 1.2%.
 |
 |
Initial claims for unemployment insurance declined by 11,000 to 207,000 in the week ending April 11, from 218,000 in the week ending April 4, revised down slightly from 219,000. The four-week average edged up to 209,750 from 209,250. The Action Economics Forecast Survey looked for 215,000 new claims to have been filed.
The total number of unemployment insurance beneficiaries—also known as “continuing claims”—rose by 31,000 to 1.818 million in the week ending April 4, from 1.787 million in the week ending March 28 (revised down from 1.794 million). The four-week moving average declined to 1.813 million in the latest week from 1.821 million in the March 28 week. The insured unemployment rate remained at 1.2% in the week of April 4. It has remained at that level since the week of November 29, 2025.
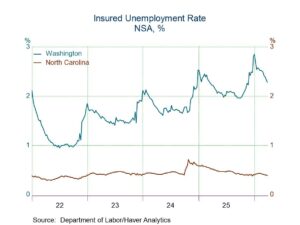
The insured unemployment rate varied greatly across individual states and territories. In the week ending March 28, the highest unemployment rates were in Rhode Island (2.50%), Massachusetts (2.50%), New Jersey (2.49%), Washington (2.28%), and Minnesota (2.16%). The lowest rates were in Florida (0.31%), Louisiana (0.31%), Alabama (0.36%), North Carolina (0.39%), and Virgin Islands (0.39%). Rates in other notable states include California (2.06%), New York (1.91%), Illinois (1.88%), Michigan (1.75%), Pennsylvania (1.56%), and Texas (1.05%). These state data are not seasonally adjusted.
Data on weekly unemployment claims are from the Department of Labor itself, not the Bureau of Labor Statistics. They begin in 1967 and are contained in Haver’s WEEKLY database and summarized monthly in USECON. Data for individual states are in REGIONW back to December 1986.
 |
 |
Comments are closed.