
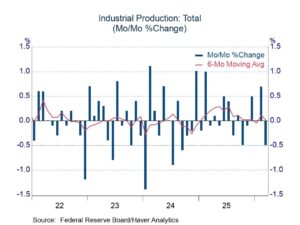
- Downward noise in utility output; slow activity in manufacturing and mining.
- Flat underlying trend in recent months.
 |
 |
The industrial production index fell 0.5% in March, noticeably weaker than the expected increase of 0.1%. In addition, the March results were joined by slight net downward revisions in prior months (sharp upward revision in February offset by a larger downward adjustment in January and tweaks in earlier months). A good portion of the March softness was the result of a drop of 2.3% in utility output, which is not deeply concerning because changes in this sector typically are driven by weather conditions. However, mining activity also was soft (-1.2%), and manufacturing production dipped 0.1%.
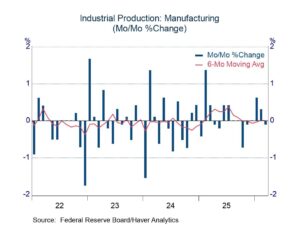
Within manufacturing, auto production played a large role in the dip, registering a decline of 3.7%. However, the auto sector had plenty of company on the soft side, as furniture, textiles, apparel, and printing all posted declines of more than 1.0%. Given these drags, manufacturing output excluding autos rose only 0.1%. There was a nearly even split between expanding and contracting industries within manufacturing: 11 boosting production and 9 reducing activity.
The dip in manufacturing activity in March might seem inconsequential in light of solid advances in January and February (up 0.6% and 0.4%, respectively). However, the gains early in the year followed a weak fourth quarter, leaving an unimpressive trend.
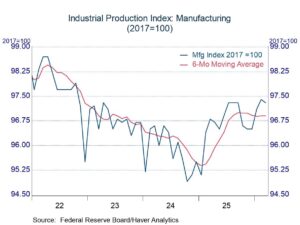
Trends in industrial activity are often more apparent by focusing on the level of production indexes rather than month-to-month (or quarter-to-quarter) changes. As shown the chart below, the level of the manufacturing index stirred for a time in 2025, but it lost momentum in the closing months of the year. Changes so far in 2026 have not pushed the index above the September 2025 peak. The 6-month moving average of the manufacturing index is now running sideways.
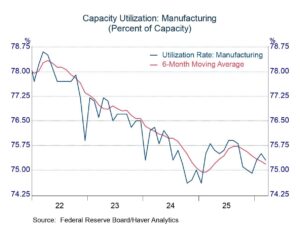
The capacity utilization rate in manufacturing has naturally reflected movement in production. Utilization rose in 2025 as production strengthened, but it retraced most of the upward movement once momentum in production faded. The utilization rate in manufacturing stood at 75.2% in March, down slightly from the average of 75.4% in 2025.
Industrial production and capacity data are in Haver’s USECON database. Additional detail on production and capacity utilization can be found in the IP database. The expectations figures come from the AS1REPNA database.
 |
 |
Comments are closed.