

- Data for both February and March were included in today’s report to catch up from delays due to the federal government shutdown last October.
- Starts fell 3.0% m/m in February but rebounded 10.8% m/m in March.
- The 7.2% q/q increase in Q1 was the largest quarterly gain since the economy reopened after the pandemic shutdown in 2020.
- In contrast, permits jumped 11.0% m/m in February but fell 10.8% m/m in March and were up only 1.0% q/q in Q1.
 |
 |
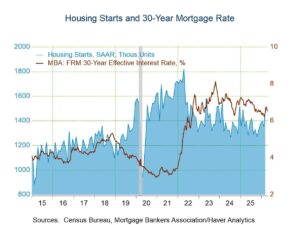
Housing starts and permits data were released for both February and March today. Release of these data has been delayed by the federal government shutdown in October 2025. Total starts fell 3.0% m/m in February to 1.356 million units from a downwardly revised 1.398 million in January (previously 1.487 million) but then rebounded to 1.502 million (+10.8% m/m) in March. The March level was the highest since December 2024 and 10.8% higher than a year earlier. The Action Economics Forecast Survey expected a 5.9% decline in March from January to a level of 1.4 million units. The 7.2% q/q increase in starts in Q1 is the first quarterly increase since Q1 2025. Residential investment has been a drag on overall GDP growth over the past year. The sharp Q1 increase raises hope that residential investment could make a small contribution to Q1 GDP growth in tomorrow’s report.
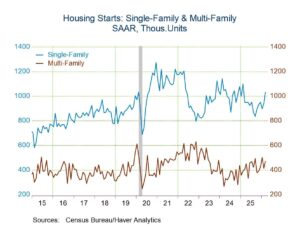
Single-family starts rose 4.8% m/m in February and 9.7% m/m in March to be 8.9% higher than a year ago. Multi-family starts plunged 17.0% m/m in February following an 18.2% monthly surge in January. They rebounded in March, rising 13.2% m/m to be up 15.5% y/y. The strong performance of starts in March following weakness earlier this year most likely reflects some catch-up as building conditions improved in March after having been very challenging in January and February.
Across the four major geographic regions, starts in the Northeast increased 24.8% m/m in March but fell 21.2% m/m in February. They were up 18.9% y/y. In the Midwest, starts increased 12.2% m/m in Mach on top of a 20.9% monthly gain in February. The March figure was down 0.9% from a year ago. In the South, starts rose 9.1% m/m in March but fell 3.6% m/m in February. In March they were up 14.1% from a year ago. In the West, starts rose 7.2% m/m in March after monthly declines of 7.7% in January and 3.7% in February. Compared with a year ago, they were up 8.0%.
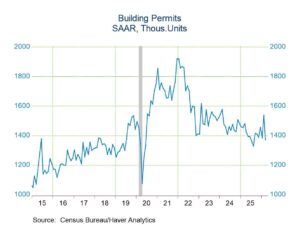
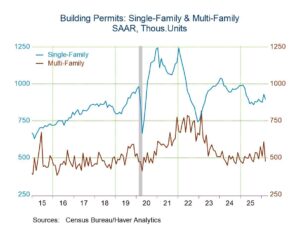
The performance of building permits in February and March mirrored that of starts. Total permits rose 11.0% m/m in February but fell 10.8% m/m in March to be down 7.4% from a year ago. Single-family permits rose 6.2% m/m in February and then fell 3.8% m/m in March. They were 7.9% lower than a year ago. Multi-family permits rebounded 19.2% m/m in February after an 11.1% m/m fall in January. In March, they plunged 21.5% m/m and were down 6.3% from a year earlier.
In March, permits fell in each of the four major regions. In the Northeast, permits plunged 29.0% m/m in March following a 5.9% monthly gain in February. In the Midwest, permits declined 3.1% m/m in February and another 2.3% m/m in March. In the South, permits slumped 7.7% m/m in March but this following a 11.8% monthly jump in February. The March decline was the third in the past four months. In the West, permits fell 14.2% m/m in March following a 21.8% monthly surge in February and a 13.8% m/m slump in January.
The housing starts and permits figures can be found in Haver’s USECON database. The expectations figure is contained in the AS1REPNA database.
 |
 |
Comments are closed.