We’re pleased to present new features in our latest Spotlight, showcasing Haver as a premier provider of the highest quality and coverage of historical time series data in the marketplace. Haver is distinguished by a dedicated research group and data team who meticulously build and refine our databases, providing clients with a foundation of reliable, high-calibre data. You can learn more about our data products here.
We’ve spotlighted some of these new features available in VG3:
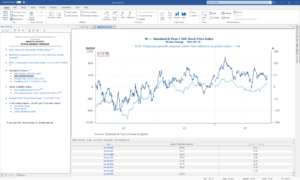
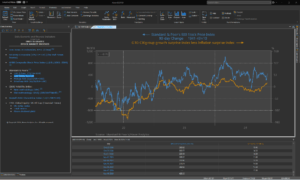
1. New look and feel
Switch between light and dark mode with a single click.
 |
 |
2. Enhanced data analysis tools
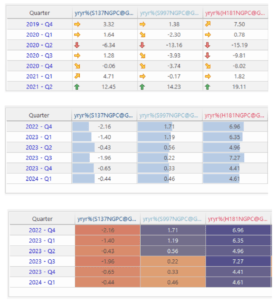
Three new types of Heat Maps are now available: Color Scales, Data Bars, and Arrow Sets.
 |
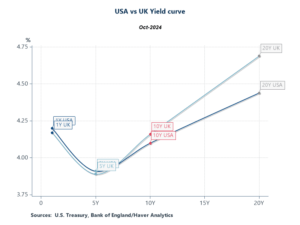
3. Enhanced yield curve capabilities
Users can now create yield curves to compare multiple periods or countries, offering more flexibility for analysis.
 |
4. Dynamic data highlights
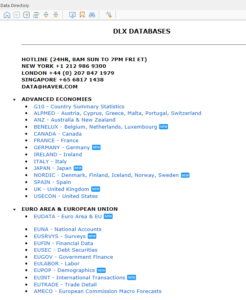
Our interface now dynamically marks newly added data series with a ‘NEW’ label, making it easy for users to spot the latest additions. This feature reflects Haver’s commitment to continually expanding our extensive data coverage, helping users stay up-to-date with the most recent information across global economies and sectors.
 |
In line with this commitment, Haver Analytics also offers flexible, client-driven data expansion. We regularly update our datasets based on requests from global research communities, allowing us to provide highly specific data needs. If there’s a dataset you need, we always do our best to accommodate and make it part of our extensive data offerings.
5. Hodrick-Prescott Filter
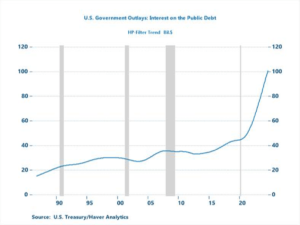
Enhance your business cycle and forecasting analysis with the newly added Hodrick-Prescott (HP) Filter, now available as a function in the formula bar. The HP filter is a time series analysis tool that separates data into long-term trends and short-term cyclical components. This allows for clearer insights into underlying economic trends and fluctuations, making it valuable for business cycle analysis and forecasting.
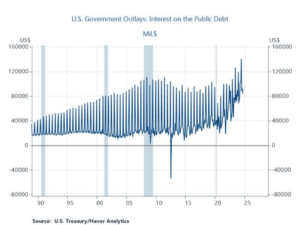
Here’s the HP filter in action with an interest payment on public debt series
Before:
 |
After applying HP Filter:
 |
6. Customizable Trend Line Parameters
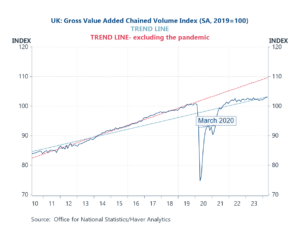
In DLXVG3, you can use trend lines to help analyze the trajectory of a variable over time. They can smooth out short-term fluctuations, allowing you to focus on the general direction of the data, be it upward, downward, or stable. Users can specify start and end dates for trend lines, allowing for precise analysis of different time periods.
 |
HaverFeed: Rapid, Seamless Data Delivery
As a reminder, HaverFeed is our data delivery service that keeps clients up-to-date with the latest data. With flexible delivery options like HaverFeed JSON Delivery, clients can easily integrate updates into ML, AI, and legacy model workflows using open-source scripts. Click here to learn more.
Haver Hierarchies
For those utilizing HaverFeed, don’t forget the powerful Hierarchies add-on. This helps you organize and access Haver’s proprietary menu structure directly within your dashboard or data container. Learn more about Hierarchies here.
Let’s connect!
Interested in how these enhancements can help you achieve your goals?
Contact [email protected] to book a demo.


Comments are closed.