

Free downloadable resources:
This week, we explore the growing impact of recent US policy moves—particularly President Trump’s “reciprocal” tariffs scheduled for April 2—with a spotlight on their implications for Asia. The effects of China’s retaliation to the US’s first round of 10% tariffs are already visible in the data (Chart 1). Similarly, in South Korea, the Biden administration’s tightening of chip export restrictions has likely contributed to a slump in the economy’s recent semiconductor exports to China (Chart 2). Despite these challenges, investor concerns about Trump’s upcoming “reciprocal” tariffs have been eased by reports suggesting they may not be a blanket measure, with certain economies potentially exempt. While the potential impact of these tariffs on Asia may initially seem significant, the effects are likely to be concentrated in a few economies, particularly India. This is mainly because, India still maintains one of the highest average tariff rates in the world (charts 3 and 4), despite progress in reducing tariffs over the years (Chart 5). In contrast, South Korea, though it has a relatively high average tariff rate, benefits from a very low effective tariff rate on US imports (Chart 6), thanks to its bilateral trade agreement with the US.
Tariff effects on China
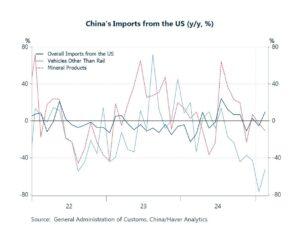
Earlier, China responded to the US’s first round of 10% tariffs on Chinese imports by placing tariffs on certain energy products and large-engine cars from the US. The effects of these tariffs are already evident in the data, as shown in chart 1. Specifically, China’s imports of US cars have continued to decline sharply, and its imports of certain energy-related products have also decreased through the year so far. However, China’s overall imports from the US have increased on a year-over-year basis. Looking ahead, investors are likely focused on the impact of China’s second round of retaliatory tariffs, which mainly target US agricultural goods.
Chart 1: China’s imports of mineral products and cars from the US
 |
Initial impacts of US chip controls
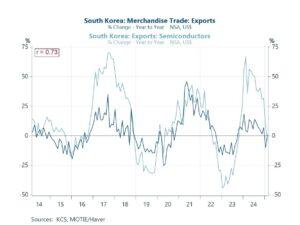
The impact of US actions extends beyond China in Asia, with tangible effects now beginning to surface in South Korea. Notably, South Korea’s semiconductor exports to China (including Hong Kong) dropped by an additional 31.8% y/y in February, worsening from the 22.5% decline recorded in January. This decline has contributed to a broader downturn in the country’s total semiconductor exports, which fell by 3% y/y, as illustrated in chart 2. However, it is important to note that the slump in South Korea’s semiconductor exports to China is not directly linked to the current US administration’s actions. Rather, it is likely a result of the tighter restrictions on chip-making equipment and semiconductor development software imposed by the Biden administration late last year, which came into effect this year.
Chart 2: South Korea’s exports growth
 |
Asia’s exposures to US “reciprocal” tariffs
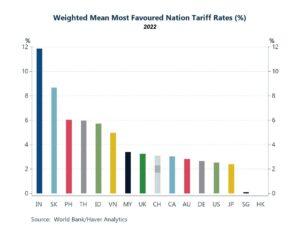
Looking ahead, investors are closely focused on April 2, the date when Trump has announced the implementation of what he calls “reciprocal” tariffs. While the initial scope of these tariffs was unclear, some additional clarity emerged recently. It now appears that the new tariffs will apply only to economies with which the US has a trade deficit and that currently impose tariffs on the US. With this new information, investors’ initial concerns about blanket tariffs on all foreign economies have likely been alleviated, although much uncertainty remains. Additionally, Trump seems to be delaying the sector-specific tariffs he had previously considered. Given these developments, the next question is which economies will be most impacted by the upcoming tariffs. To begin addressing this while focusing on Asia, we examine the tariff rates imposed by the US’s trading partners, as shown in chart 3. The chart illustrates the weighted average most-favoured-nation (MFN) tariff rates. Several economies stand out, particularly India and South Korea, followed by Southeast Asian economies like the Philippines, Thailand, and Indonesia, albeit to a lesser extent.
Chart 3: Economies’ weighted mean most favoured nation tariff rates
 |
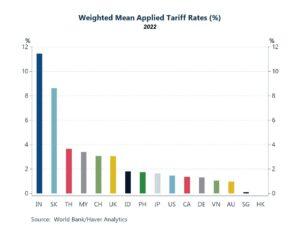
Diving deeper, we examine the actual product-weighted tariff rates of these economies, as shown in Chart 4. The data reveals that the actual weighted tariff rates are often significantly lower than the reported MFN rates, likely due to trade agreements (bilateral or multilateral) that have reduced or eliminated some tariffs. However, the actual average tariff rates for India and South Korea are not much lower than their respective MFN rates. This raises the question of why these two economies maintain relatively high tariff rates compared to other Asian economies, such as Singapore, which imposes almost no tariffs on imports on average. Furthermore, especially in the case of India, the economy meets two key conditions for Trump’s “reciprocal” tariffs. First, the US runs a substantial trade deficit with India. Second, India already imposes high tariffs on US goods. As a result, these factors make India particularly vulnerable to Trump’s “reciprocal” measures if the tariffs take effect on April 2.
Chart 4: Economies’ weighted mean applied tariff rates
 |
Potential effects on India
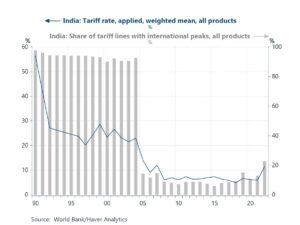
Starting with India, despite still having relatively high import tariffs, the economy has made significant progress in reducing them in recent decades. As shown in chart 5, India’s weighted average tariff rate was above 50% in 1990, but it gradually decreased to below 10% by the late 2000s. However, this rate crept back above 10% in 2022. Additionally, the share of tariff lines with international peaks — meaning the proportion of items in India’s tariff schedule with rates above 15% — has dropped significantly from nearly 100% in the 1990s and early 2000s. That said, it is worth noting that the share can be influenced by the inclusion of more items in the tariff schedule. Ahead of the looming April 2 tariffs, India has already taken steps to engage with the US, likely in an effort to reduce or avoid the impact of these trade actions. For instance, India’s Commerce Minister has visited the US twice to discuss a potential trade deal. India seems to be taking broader steps as well to spur trade, as it continues to pursue free trade agreements with both the UK and the EU.
Chart 5: India’s import tariffs
 |
Potential effects on South Korea
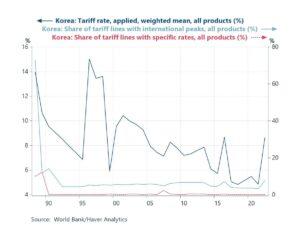
Turning to South Korea, while its average tariff rate is relatively high, just below India’s, a closer look at its specific relationship with the US suggests that the “reciprocal” tariffs on South Korea could be more muted. This is due to South Korea’s very low effective tariff rate on US imports, which was below 1% in 2024, according to the South Korean government. The reason for this low rate is largely the United States-Korea Free Trade Agreement (KORUS FTA), which, since its implementation in 2012, has eliminated tariffs on most US imports. Despite this, in light of the potential April 2 tariffs, South Korea’s trade minister has already requested exemptions from the US’ “reciprocal” tariffs, and both countries have established a working-level channel to discuss tariff-related issues.
Chart 6: South Korea’s import tariffs
 |
Join our mailing list to know when our latest Economic Letter from Asia and Charts of the Week are released.
Browse all our database offerings here.
Comments are closed.