
Free resources:
Financial market sentiment has rebounded in recent weeks, buoyed by signs of de-escalation in the US-led trade war and growing confidence that central banks—particularly the Federal Reserve—will step in with more rate cuts to cushion any fallout. Yet beneath the surface, a more sobering picture of the global economy persists. For example, latest PMI surveys reveal that global business expectations have slumped to their lowest levels since the pandemic, reflecting widespread unease about the growth outlook (chart 1). While supply chain pressures have so far remained contained, suggesting no repeat of the logistical chaos seen during the pandemic (chart 2), the latest Blue Chip Financial Forecasts survey reveals that forecasters are now pencilling in deeper and more widespread monetary easing than previously anticipated—an acknowledgment that demand is faltering (chart 3). Falling oil prices further reinforce this view: they are both a symptom of weakening global demand and a potential source of disinflation, reducing the urgency for central banks to maintain tight policy (chart 4). At the structural level, the US economy’s increasing reliance on intangible assets—ranging from intellectual property to reputation—has made it more vulnerable to geopolitical frictions and the erosion of global trust (chart 5). This risk is compounded by America’s dominant role in AI investment, a sector symbolic of both its economic strengths and its exposure to international perceptions (chart 6). The longer-term challenge, then, is not just navigating the current downturn, but ensuring that the institutional goodwill and cross-border openness that support the modern US economy are not sacrificed in a more fragmented and uncertain global order.
The global business cycle
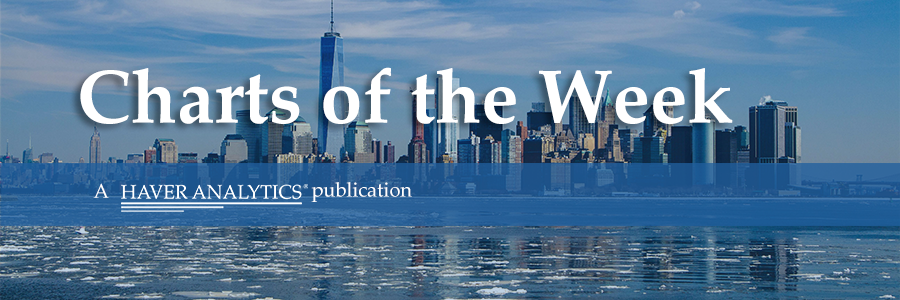
The recent sharp decline in the Future Output Balance in the global composite PMI survey reflects a sudden deterioration in global business expectations. The sweeping tariffs, introduced in April 2025, have generated heightened uncertainty around trade policy and sparked fears of retaliatory actions from key trading partners. As a result, businesses worldwide are scaling back their expectations for future output, wary of rising costs, disrupted demand flows, and a broader shift toward protectionism that could undermine global economic momentum.
Chart 1: Global Composite PMI: Future Output Balance
Note: The extreme declines in the Future Output Balance that were recorded in the early months of 2020 (at the height of the COVID pandemic) have been removed from this chart.
Global supply chain pressures
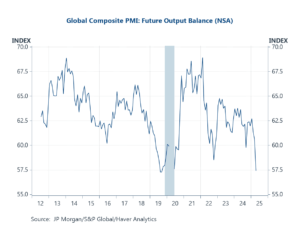
Still, despite the marked deterioration in global business expectations, this second chart below provides a reassuring counterpoint: as of now, there is little evidence that global supply chain pressures have materially intensified. Both the New York Fed’s Global Supply Chain Pressure Index and the Baltic Exchange Dry Index remain relatively subdued, especially compared to the pandemic-era spikes of 2020–2022. While there has been heightened concern following the April 2025 US tariff announcements, these trade policy shifts have yet to translate into measurable physical disruption in logistics or freight rates. The stability of these indices suggests that although sentiment has taken a hit, global shipping networks and supply flows are, for now, absorbing the shock. However, this calm may prove fragile if the policy environment hardens further or retaliatory trade actions begin to compound the strain.
Chart 2: The Global Supply Chain Pressure Index versus the Baltic Dry Index
Expectations for central banks’ policy rates
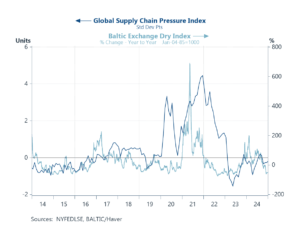
Adding to the picture of mounting economic caution, the latest Blue Chip Financial Forecasts survey reveals that expectations for policy easing over the next 12 months have become even more pronounced than in previous months. While earlier surveys had already pointed to a further extension of the global rate-cutting cycle, the latest results suggest forecasters now anticipate a deeper and more aggressive round of monetary easing—most notably from the US Federal Reserve, which is now expected to deliver nearly a full percentage point in rate cuts over the next 12 months. The sharp deterioration in business sentiment is reshaping the macro narrative: central banks are no longer simply guiding inflation lower, but are instead preparing to confront the risk of a deeper, demand-driven slowdown.
Chart 3: Blue Chip Financial Forecasts: Expectations for policy rates in 12 months time
Energy prices and inflation
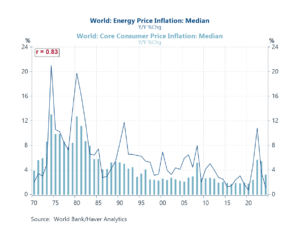
Adding further context to the growing expectations for policy easing, oil prices have dropped sharply in recent weeks—driven by mounting concerns over global growth, as reflected in weakening business sentiment and softer demand indicators. The chart below provides a longer-run perspective on why this matters: energy prices have historically played a central role in shaping the global inflation trajectory. The strong positive correlation (r = 0.83) between median world energy price inflation and median core consumer price inflation underscores the powerful pass-through effects energy costs can have on broader price dynamics. While core inflation tends to be stickier, this historical relationship makes clear that sustained declines in energy prices often foreshadow broader disinflationary trends.
Chart 4: Global energy price inflation versus global core CPI inflation
Intangibles versus tangibles
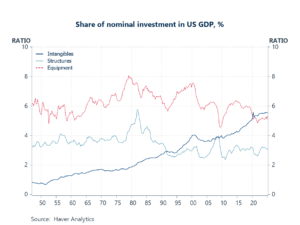
Shifting focus from short-term cyclical risks to longer-term structural dynamics, the next chart below underscores a fundamental transformation in the composition of US investment: the economy has increasingly been built on intangibles. Over the past several decades, investment in intangible assets—such as software, intellectual property, R&D, and brand equity—has steadily climbed and, since the mid-2010s, has overtaken investment in both structures and equipment as a share of GDP. This shift reflects the rise of a knowledge-based, innovation-driven economy, but it also introduces new forms of vulnerability. Unlike physical capital, intangible assets rely heavily on trust, reputation, legal protections, and global openness. In this context, escalating trade frictions and a more confrontational US economic stance—as signalled by the recent tariff wave—risk eroding the goodwill and institutional credibility that underpin much of the value created by intangibles. If geopolitical uncertainty undermines the perceived reliability of US intellectual property protections or weakens global collaboration, it could pose a deeper structural challenge to future growth than any immediate cyclical downturn.
Chart 5: US investment shares: Intangibles versus Tangibles
Investment in Artificial Intelligence
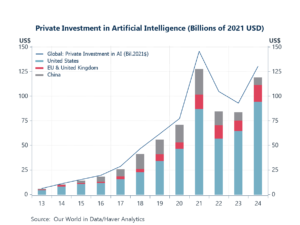
The centrality of intangibles to the US growth model is nowhere more evident than in the explosion of private investment in artificial intelligence. As this chart illustrates, global AI investment has surged over the past decade—reaching new highs in 2024—and the United States has consistently accounted for the lion’s share of that spending. This reflects not only America’s previous leadership in frontier technologies but also its dependence on intangible capital, from algorithms and data infrastructure to human expertise and institutional trust. However, this dominance also underscores the strategic stakes of current policy choices. In an environment of rising trade tensions and potential fragmentation, the foundations of US leadership in AI—cross-border collaboration, data openness, and global market access—could be at risk.
Chart 6: Private investment in AI
Please send an email to [email protected] to sign up to our weekly newsletters.
Browse all our databases here.
Comments are closed.